Goals and Objectives
The transportation of significant quantities of hazardous materials by rail is a common practice in
Canada and globally. While rail transport maintains a generally strong safety record, the occurrence of
train incidents remains a possibility. When such incidents involve trains carrying hazardous materials,
the potential for release poses a considerable threat to human health and the environment. Prompt and
effective response is crucial to minimizing the consequences of such events. Therefore, the capacity for
rapid assessment of the likelihood of hazardous material release following a rail incident represents a
critical initial step in emergency response protocols. Furthermore, proactive evaluation of potential
release scenarios prior to operations can empower operators to implement effective risk mitigation
strategies. The Rail HAZMAT Release Predictor is designed to address these critical needs.
The Rail HAZMAT Release Predictor is a web-based application leveraging artificial intelligence
methodologies to forecast the probability of hazardous material release in the event of train-related
incidents. The machine learning models underpinning this application have been trained using Canadian
incident data. Consequently, its predictive capabilities are best suited for application to incidents
occurring within Canada.
The primary objective of this application is to equip rail companies, transportation agencies, and
emergency management personnel with a tool for the rapid assessment of potential hazardous material
releases in the aftermath of a rail incident. This is achieved by providing readily accessible
information concerning the involved trains and a predictive analysis of the likelihood of release.
Data
A detailed dataset covering over two decades (January 1999 to May 2023) was created to build predictive
models for potential hazardous material releases in rail transport. This dataset incorporates 5,791 rail
incidents involving hazmat carriers from the Transportation Safety Board of Canada, enriched with hourly
weather data from Open-Meteo, topographical
elevation, and regional hazmat transportation volumes from Statistics Canada. The target variable
indicates whether a release occurred (1) or not (0).
Input Variables
Time and location-related variables
| Variable Name |
Definition and Description |
Possible Values and Statistics |
| Day or Night |
Occurrence time (Day or night) |
Day (58.88%), Night (41.12%) |
| Province |
The geographic region where the accident or incident occurred |
Alberta (25.51%), British Columbia (15.53%), Ontario (29.27%), Quebec (11.56%), Others (18.03%)
|
| Elevation |
The height (in meters) above sea level at the location of the accident |
Mean: 423.37, Std Dev: 395.30, Min: 0, Max: 2328 |
Activity, track, and train-related variables
| Variable Name |
Definition and Description |
Possible Values and Statistics |
| Activity Type |
The Accident/Incident Case |
Inspection and maintenance (25.49%), Proceeding (14.06%), Switching (50.00%), Others (10.45%)
|
| Accident/Incident Type |
The type of train activity at the time of the occurrence |
Derailment (47.88%), Collision (15.25%), Dg Leaker (32.28%), Others (4.59%) |
| Total Hazmat Cars Involved |
The total number of cars transporting dangerous goods was involved in the occurrence |
1 (74.51%), 2 (12.87%), More than 2 (12.63%) |
| Number of Trains Involved |
Number of trains involved |
1 (79.68%), More than 1 (20.32%) |
| Track Type |
Type of Track |
Yard (72.59%), Main (11.76%), Other Than Main or Yard (15.65%) |
| Sub-Division Owner |
The owner of the subdivision where the occurrence took place |
CN – Canadian National Railway Co. (54.65%), CP - Canadian Pacific Railway Co. (29.46%), Others
(6%) |
Load-related variables
| Variable Name |
Definition and Description |
Possible Values and Statistics |
| Operation Volume |
The total weight of hazmat transported is measured in metric tons for the month |
Mean: 2645547.88, Std Dev: 1317424.092, Min: 834365, Max: 6552497 |
| Hazmat-Class |
The classification of hazardous materials involved in the incidents |
Class 2 (27.18%), Class 3 (33.68%), Class 8 (11.28%), Others (27.86%) |
Weather-related variables
| Variable Name |
Definition and Description |
Possible Values and Statistics |
| Rain |
Liquid precipitation of the preceding hour in centimeters, including local showers and rain from
large-scale systems |
Mean: 0.064, Std Dev: 0.298, Min: 0, Max: 5.7 |
| Snow Fall |
Snowfall amount of the preceding hour in centimeters |
Mean: 0.015, Std Dev: 0.094, Min: 0, Max: 1.96 |
| Cloud Cover |
Total cloud cover as an area fraction (%) |
Mean: 47.37, Std Dev: 37.99, Min: 0, Max: 100 |
| Weather Code |
Weather conditions are represented as a numeric code (WMO weather interpretation codes) |
Clear (32.28%), Nearly clear (20.74%), Partly cloudy (12.50%), Cloudy (18.05%), Drizzle-Not
Freezing (0.85%), Rain-Not Freezing (5.13%), Continues Snowfall (2.71%) |
| Temperature |
Air temperature at 2 meters above the ground (°C) |
Mean: 5.587, Std Dev: 12.85, Min: -36.4, Max: 33.4 |
| Relative Humidity |
Relative humidity at 2 meters above ground (%) |
Mean: 70.640, Std Dev: 17.35, Min: 11, Max: 100 |
| Wind Speed |
Wind speed at 10 meters above the ground (m/s) |
Mean: 12.39, Std Dev: 7.06, Min: 0, Max: 51.8 |
Target/Output variable
| Variable Name |
Definition and Description |
Possible Values and Statistics |
| Hazmat Released Indicator |
Indicates the release of dangerous goods from train cars |
0 (98.26%), 1 (1.74%) |
Machine Learning Methods
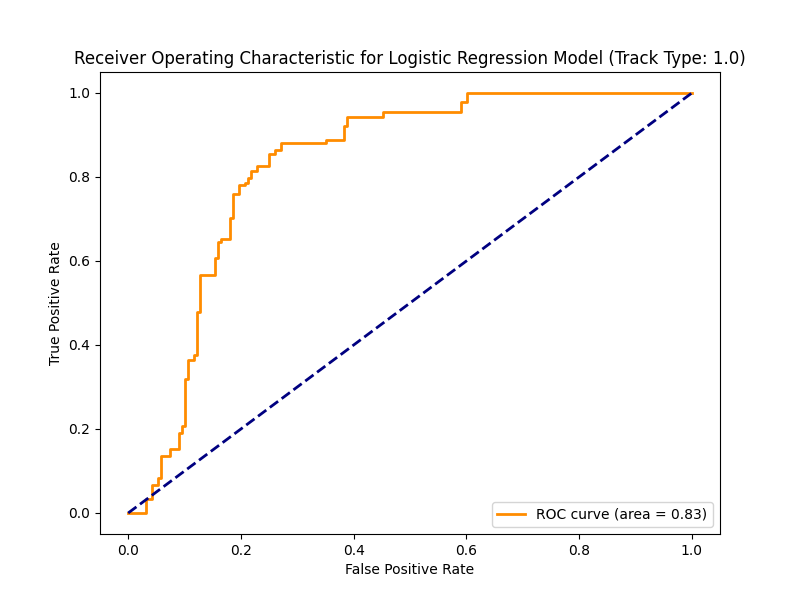
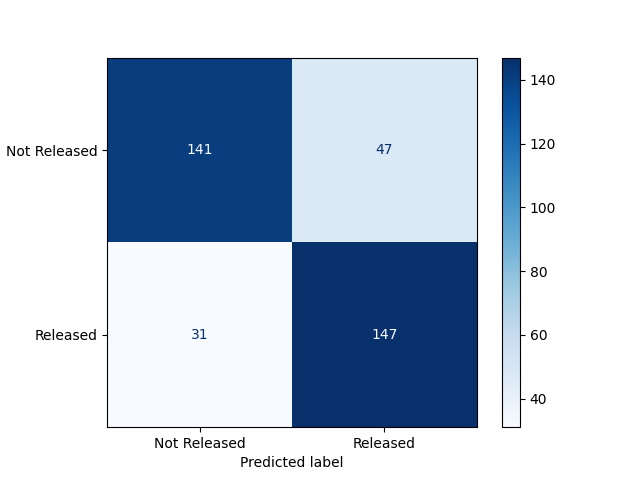
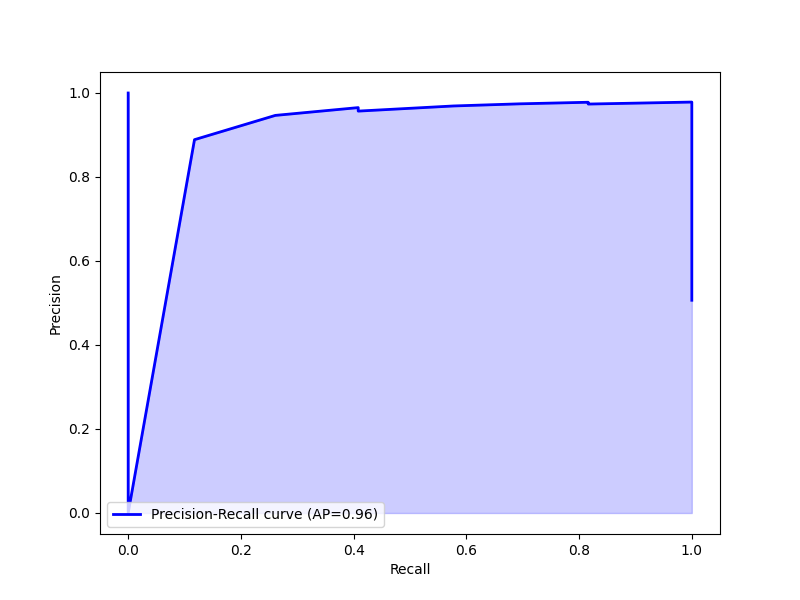
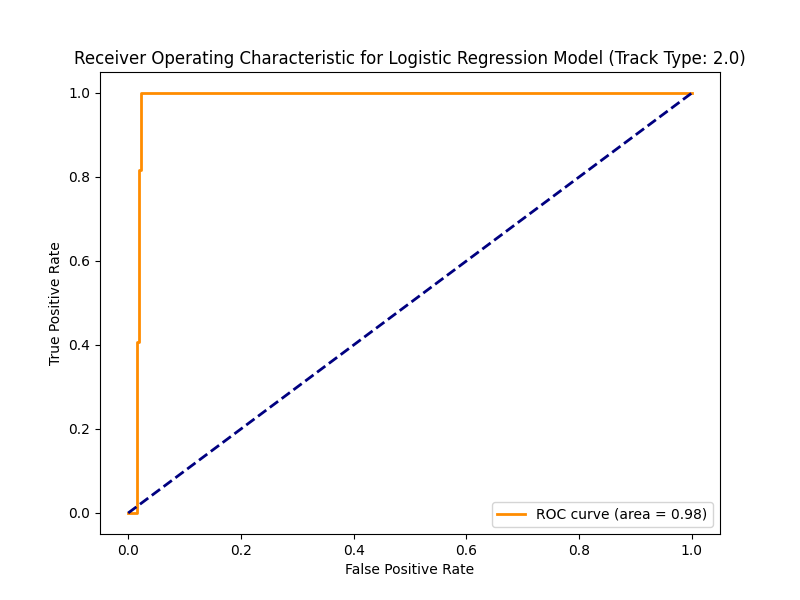
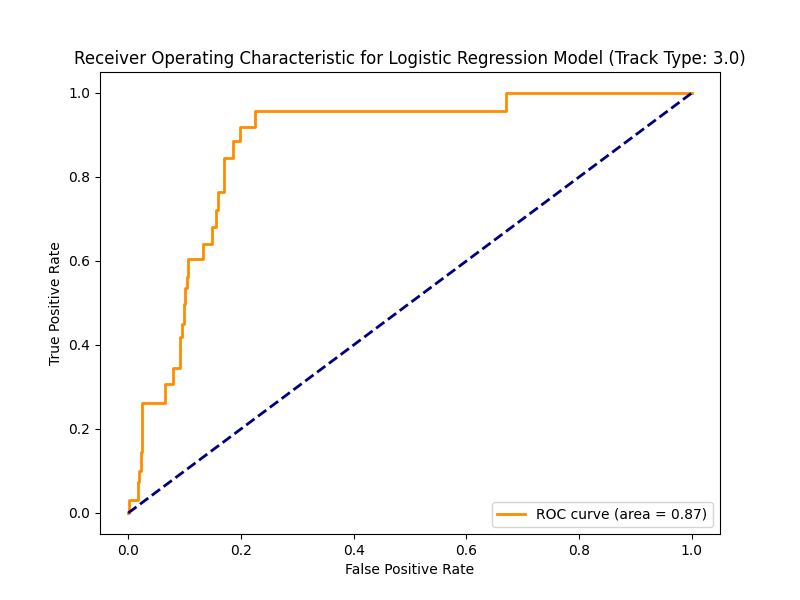
- Logistic Regression
- Neural Network
- Decision Tree
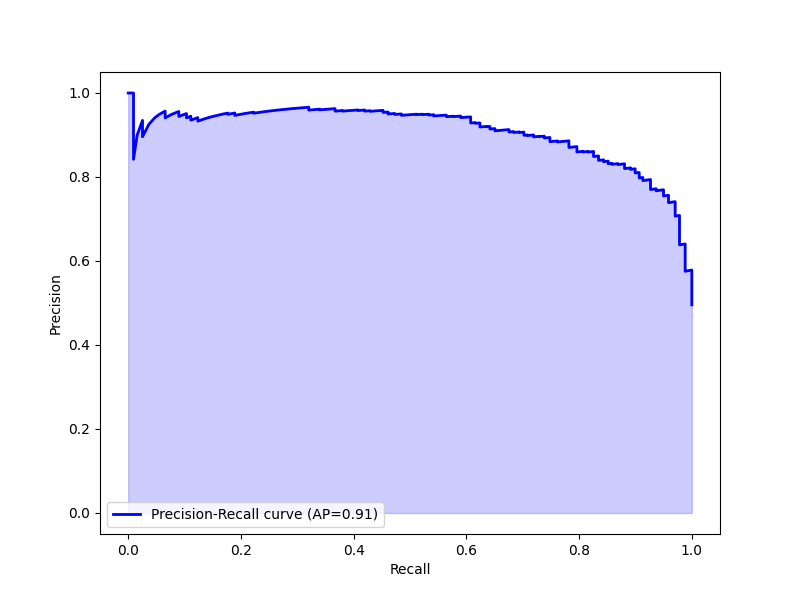
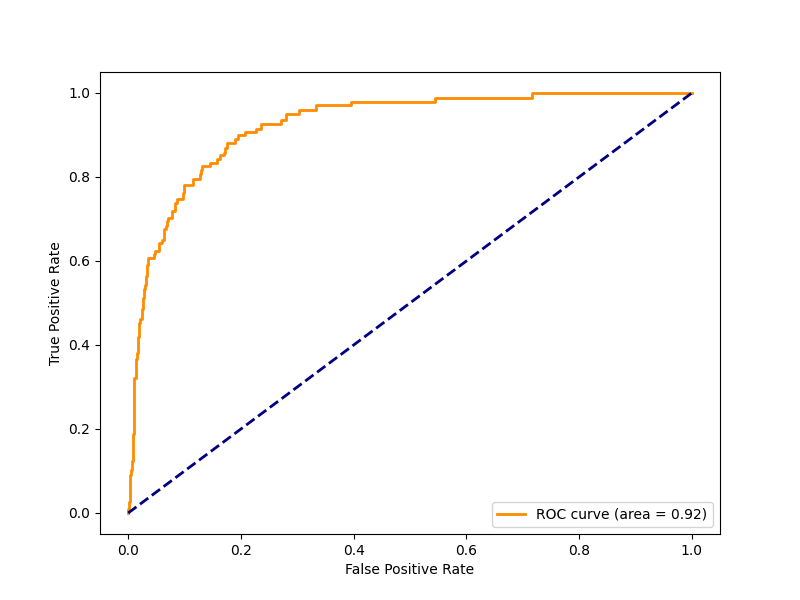
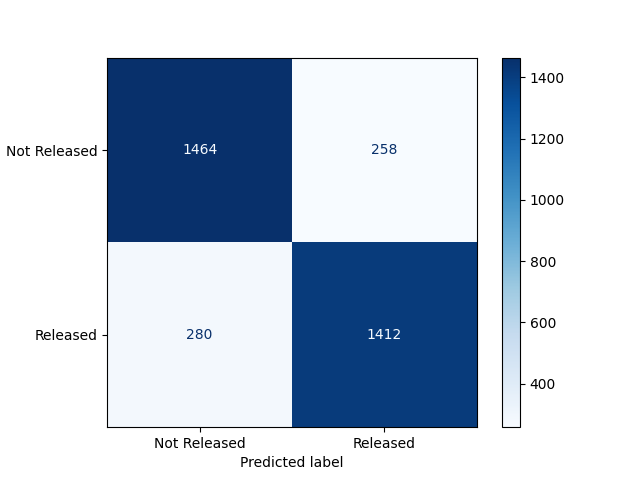
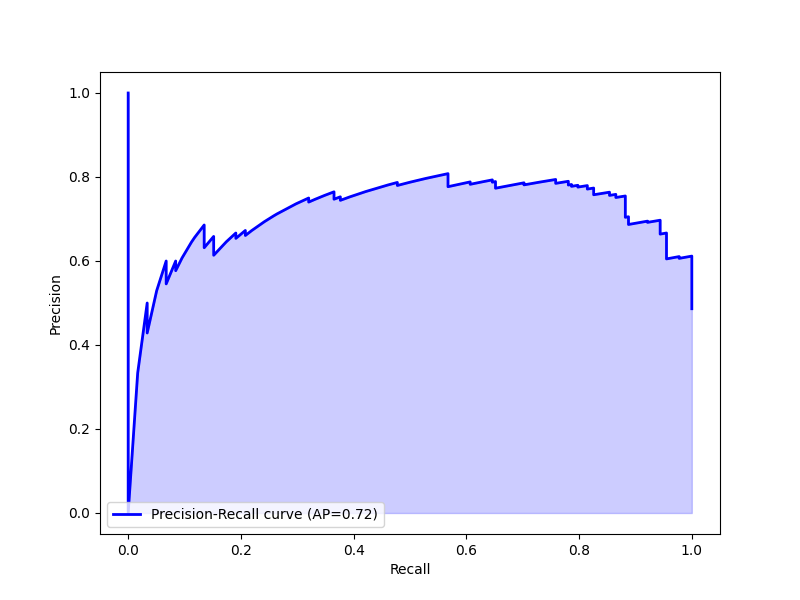
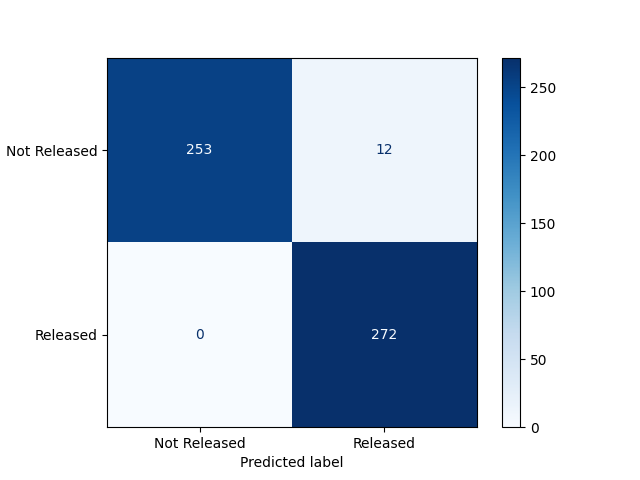
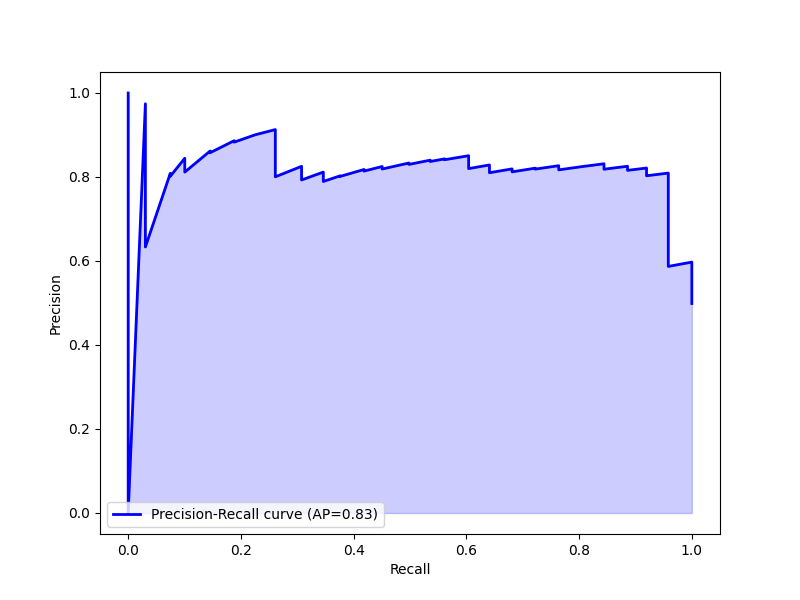
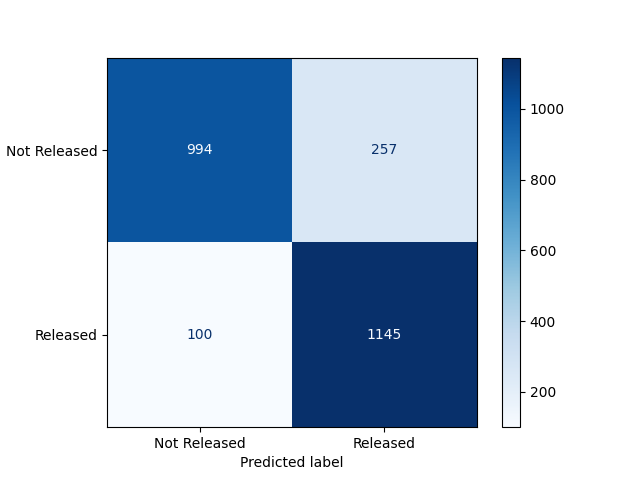
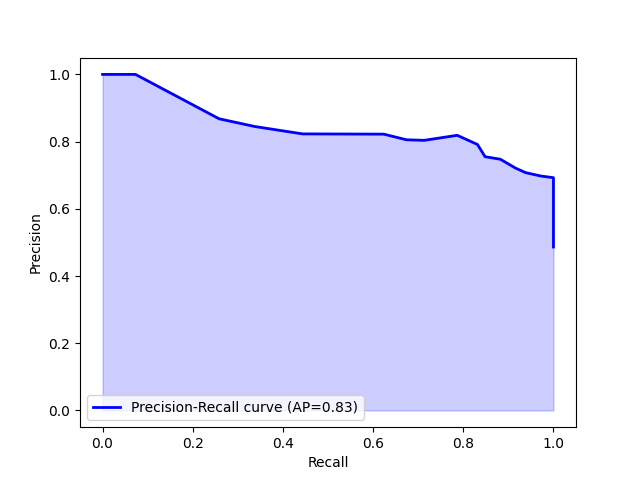
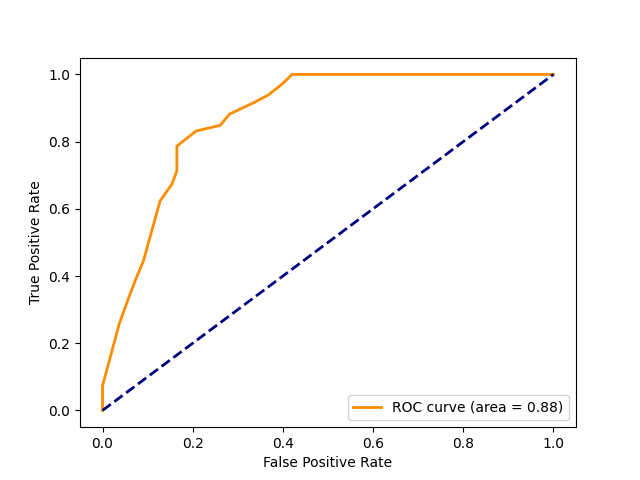
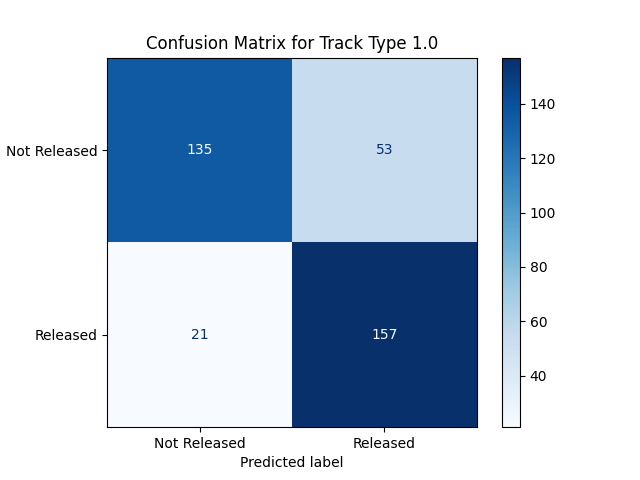
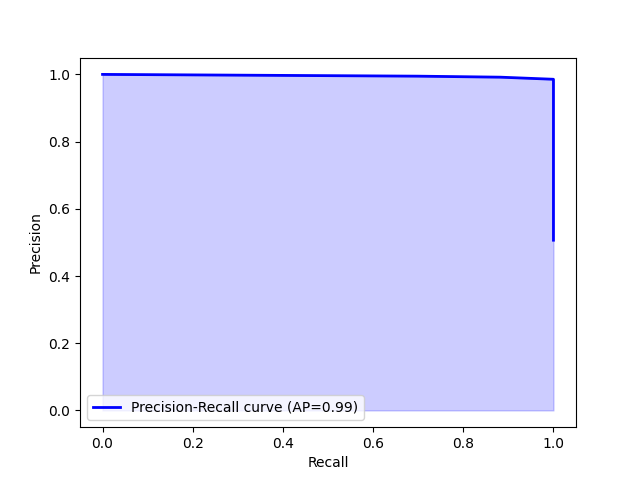
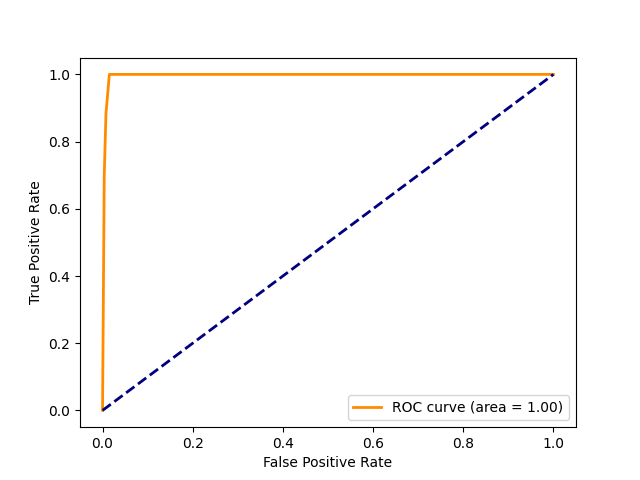
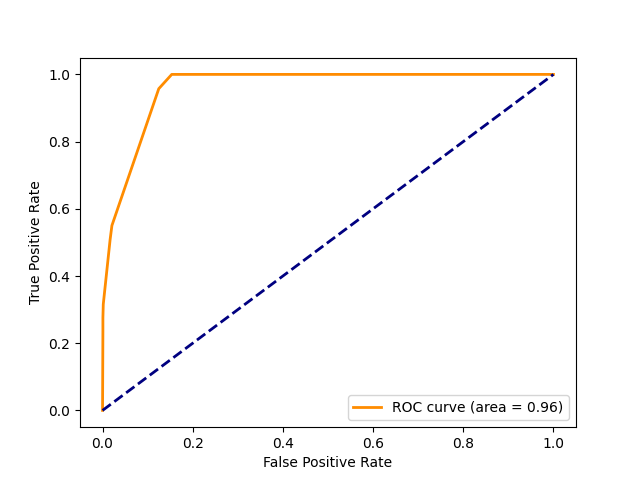
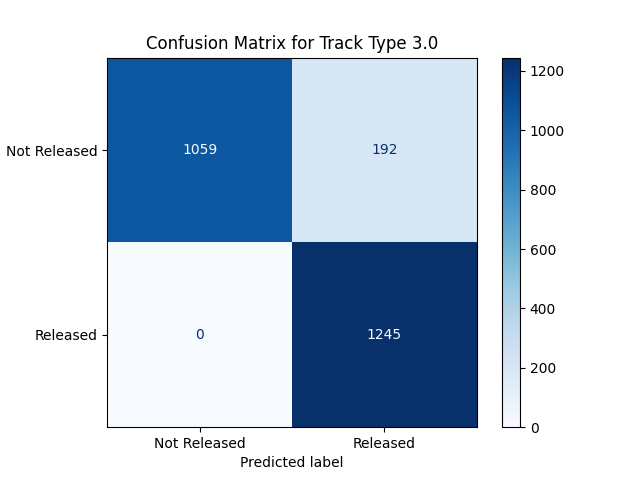
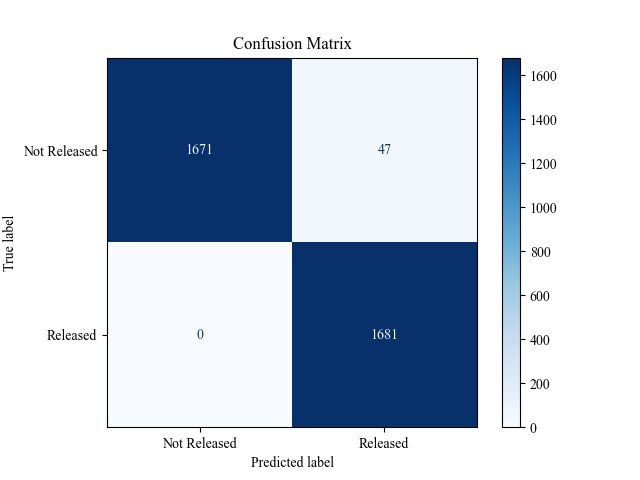
Performance of Machine Learning Models